learn
trubel&co builds technical capacity through curated STEM coursework that advances civic innovation. Our programs create a pipeline of changemakers committed to improving their community using equitable data analytics, responsible technology, and inclusive design.

We create learning environments where students leave with increased technical proficiency, a concrete understanding of the role identity & place play within STEM, and an opportunity to design & implement their own vision for civic change.
Our Programs Build
Core Competencies
-
Measuring academic performance and continued engagement with STEM coursework over time
-
Awareness of careers within STEM & innovation; preparedness and retention indicators within such fields
-
Ability to communicate technical insights with broad population; ability to collaborate in diverse teams
-
Comprehension & comfort with applying new technical skills to create innovative solutions
-
Ability to identify societal inequity, understand their root causes, & motivation to take action
-
Confidence in their capability to work through ambiguity & solve complex problems without giving up
MAPPING JUSTICE
Designing Geospatial Tools for Social Change
Mapping Justice champions diverse high school youth to design geospatial tools for social change, using GIS (Geographic Information Systems) to promote equity within their community. In the course, students focus on technical skill building, critical consciousness, and civic innovation.
Instruction on Geospatial Data Analytics
GIS enables multiple technical pathways, including data analytics & visualization, product design, coding, and urban science, building critical skills applicable to a variety of careers.

Curricula on Race, Power & Technology
Facilitators guide learning on responsibility/ethics in STEM, and on how identity & place impacts innovation. Learn more about our approach here.

Self-Directed Student Capstone
Students create maps, dashboards, and digital apps that utilize geospatial analytics to tackle complex community-based challenges tied to identity, place, and areas of passion.

Why GIS?
The geographic approach has enabled students to explore many social issues with data.
In class, students frame, visualize, & grapple with complex problems with real world implications.
In the field, GIS is used to drive decision-making across industries to assess both macro & micro questions around the “where” of their operations.
Esri, the leading geospatial technology provider, has partnered with trubel&co to expand access to GIS and spatial thinking since our beginning.
Educational benefits for students who use GIS

-
Spatial thinking is crucial to understanding our increasingly interconnected, complex world, and it’s key to solving the serious problems we are facing in that world.
-
GIS is a natural system for teaching critical thinking skills. Students who learn GIS are better equipped at utilizing data to uncover trends, tell stories, and solve complex issues.
-
Students empowered with the skills, content knowledge, and perspectives gained from GIS instruction like Mapping Justice have the confidence and ability to become change agents in their future workplace.
-
When students use GIS and geographic inquiry to grapple with problems, as Esri and Mapping Justice instructors have witnessed thousands of times over the past 20 years, students engage in five key fluencies. Creating interactive maps alone is key to creative fluency, and thinking critically about maps is key to success with media fluency as well as many aspects of modern life.
Learning Outcomes
Each cohort moves on from Mapping Justice with the awareness of how geospatial tools can advance a social mission and understand the power of responsible technology.
After completing this course students will have successfully:
Developed their potential in spatial analysis via ArcGIS, building technical literacy in the applications of data and furthering competency in analytics (e.g., data collection, cleaning, analysis, interpretation, visualization)
Explored the realm of justice, responsible tech, and how spatial data enables social movements and liberation (through both a historic and modern lens)
Created a visualized dashboard (e.g., series of maps telling a story) that is visually-compelling, impactful, and advances the development of the issue
Improved their ability to devise & communicate a research plan and its outcomes
Enabled one’s self-efficacy in self-directed learning & proactive development
Explore Mapping Justice Capstones
by Christian Ray Fontanez and Chiziterem Dominic Onyedeke
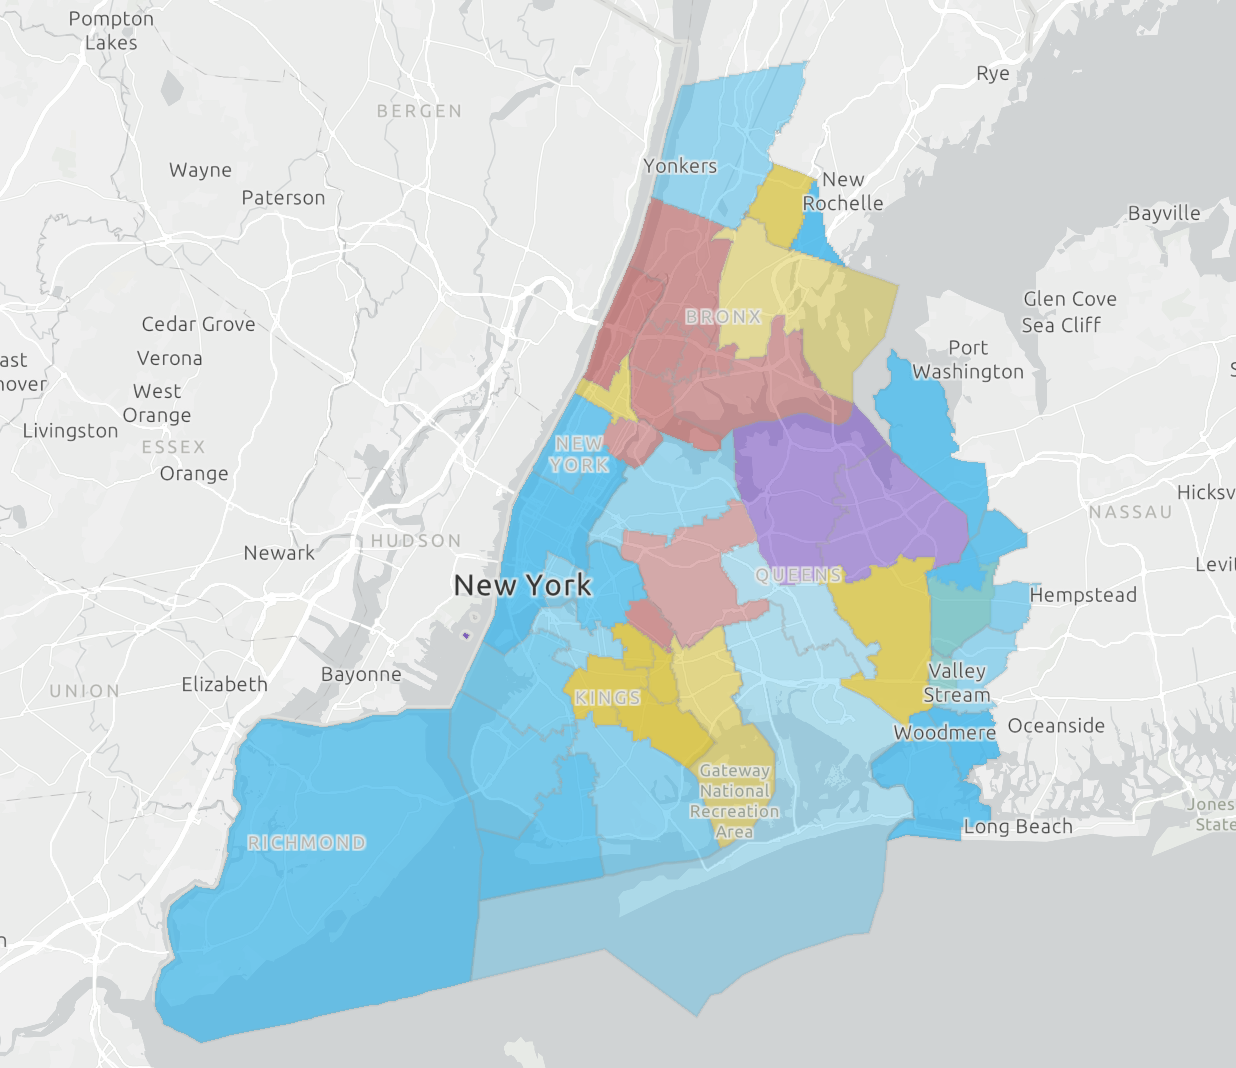
As it currently stands, schools vary massively in academic performance, and such is strongly correlated with a neighborhood's economic status and demographics.
Travel Inequality of New York City Students: Correlation between travel distance, neighborhood, and quality of education
Fast Food Influences in the School District of Philadelphia: An evaluation of Philadelphia fast-food locations relative to minority-based and white-based school locations
by Oluwaseun Ogundimu and Ruhe Solomon
How might we identify locations experiencing disproportionate fast food influences to target for social change?

by Ogechi Okafor and Edelawite Sasahulih
In our map, we will be analyzing the world's immigration patterns in relation to environmental issues. To view the effects climate has on migration, we have picked two countries that have experienced the influence of floods and droughts each and the immigration patterns from that country.
The Great Climate Migration: A visual correlation of migration patterns around the world due to climate change

by Emma Oyakhire and Johnny Lin
How can tech companies in Silicon Valley help underrepresented schools neighboring them get access to technology (e.g., a personal computer and high-speed internet)?
The Digital Divide: Technologically disadvantaged schools in Silicon Valley, the most technologically induced realm
